
- November 4, 2020
- Posted by: museswow
- Category: News
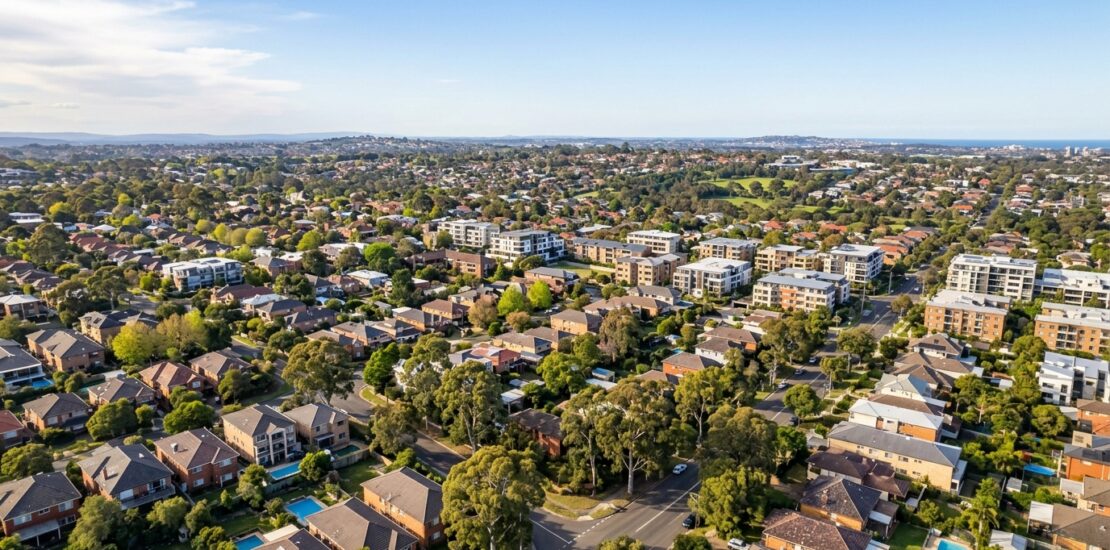
October 2020 overview
After five months of falling home values, the national home value index turned positive in October 2020, rising 0.4%. It’s a modest number on its own, but it matters. This was the first time the index had moved upward since the COVID downturn pushed values lower in April 2020, and it was a signal the market was stabilising across most of the country.
Almost every capital city joined the recovery. Adelaide, Hobart, Darwin and Canberra all recorded gains of 1% or more. Sydney posted a small but welcome uptick of 0.1%. Melbourne was the one exception, dipping 0.2% for the month. Even that result carried good news: it was the smallest monthly decline Melbourne had seen since the downturn began, suggesting the worst of the city’s COVID impact was passing.
If you’ve been thinking about making a move, the data is pointing in an encouraging direction. Before competition picks up, it’s worth taking a few minutes to check your borrowing power so you know exactly where you stand.
Signs of recovery
The numbers behind the headline tell an even more encouraging story. Consumer sentiment jumped 11.9% in October, according to the Westpac-Melbourne Institute index. Australians responded strongly to the federal budget announcement and the flattening of the COVID infection curve, and that renewed confidence flowed directly into property activity.
Stock levels remained tight despite the uptick in listings. Advertised housing stock rose by less than 1% during October, even though new listings climbed 25.2% compared to September 2020. That gap tells you buyers were absorbing property as fast as it came to market. Strong absorption typically puts upward pressure on prices over time, which is exactly the pattern that was playing out.
Nationwide home sales were up 7% in October and were only 1.5% below the same time last year. The comparison is slightly flattering — Melbourne’s lockdown dragged the national figure down with an 18.2% sales drop — but the broader market clearly recovered ground in a meaningful way.
Auction results backed this up. For the first time since March 2020, Sydney’s clearance rate climbed above 70% in October. Melbourne told its own story: there were no auctions at all in September due to Stage 4 restrictions, but in the final week of October more than 600 auctions were held with a 75.8% clearance rate. That’s a remarkable rebound.
To put this recovery in perspective, see how the market was tracking in July 2020 — the contrast shows how quickly conditions can shift.
Houses vs units
One of the more striking trends in the October 2020 data was the widening gap between house rents and unit rents across capital cities. The two had been pulling apart for months, and by October the divergence was significant.
From March through to October 2020, cumulative unit rents across the combined capital cities fell 4.8%. House rents over the same period rose 0.4%. October itself continued the trend: unit rents dropped another 0.7% for the month while house rents climbed 0.5%.
The divergence was sharpest in Melbourne and Sydney. CoreLogic’s research director Tim Lawless pointed to two main drivers. First, both cities had seen years of strong high-rise apartment construction, adding substantial supply to the inner-city unit market. Second, overseas migration had essentially stopped. International students and new arrivals who would normally be occupying inner-city units had disappeared from the rental pool almost overnight.
For investors, the message was clear. Houses in most capital cities were holding their rental income well. Units — particularly in the inner rings of Melbourne and Sydney — were facing real pressure from both sides of the supply and demand equation.
RBA rate cut impact
Just days after the October data was published, the Reserve Bank of Australia made a historic move. On 3 November 2020, the RBA cut the official cash rate to 0.1% — the lowest it has ever been. This wasn’t a minor adjustment. It represented a fundamental shift in the cost of borrowing money in Australia.
Historically, rate cuts have a reliable and measurable effect on the housing market. When mortgage rates fall, buyers can afford to borrow more, and that increased purchasing power drives more activity and upward pressure on prices. At 0.1%, the cash rate was as stimulatory as monetary policy gets.
For anyone with a mortgage or considering taking one out, the November cut was genuinely significant. Lenders were widely expected to pass through at least part of the reduction, bringing variable rates to some of the lowest levels ever available in Australia. Find out how this RBA rate cut could affect your borrowing power — the difference to your maximum loan amount can be larger than you might expect.
What to watch
The recovery in October 2020 was real, but there were genuine risks on the horizon worth keeping an eye on.
The main headwinds:
The cushioning factors working in the market’s favour:
On balance, the market had more support underneath it than the headline risks suggested. That said, it always pays to go into any purchase with a clear view of your numbers. You can run the numbers with our loan repayment calculator to see what different loan sizes and interest rates would actually cost you each month before you commit.